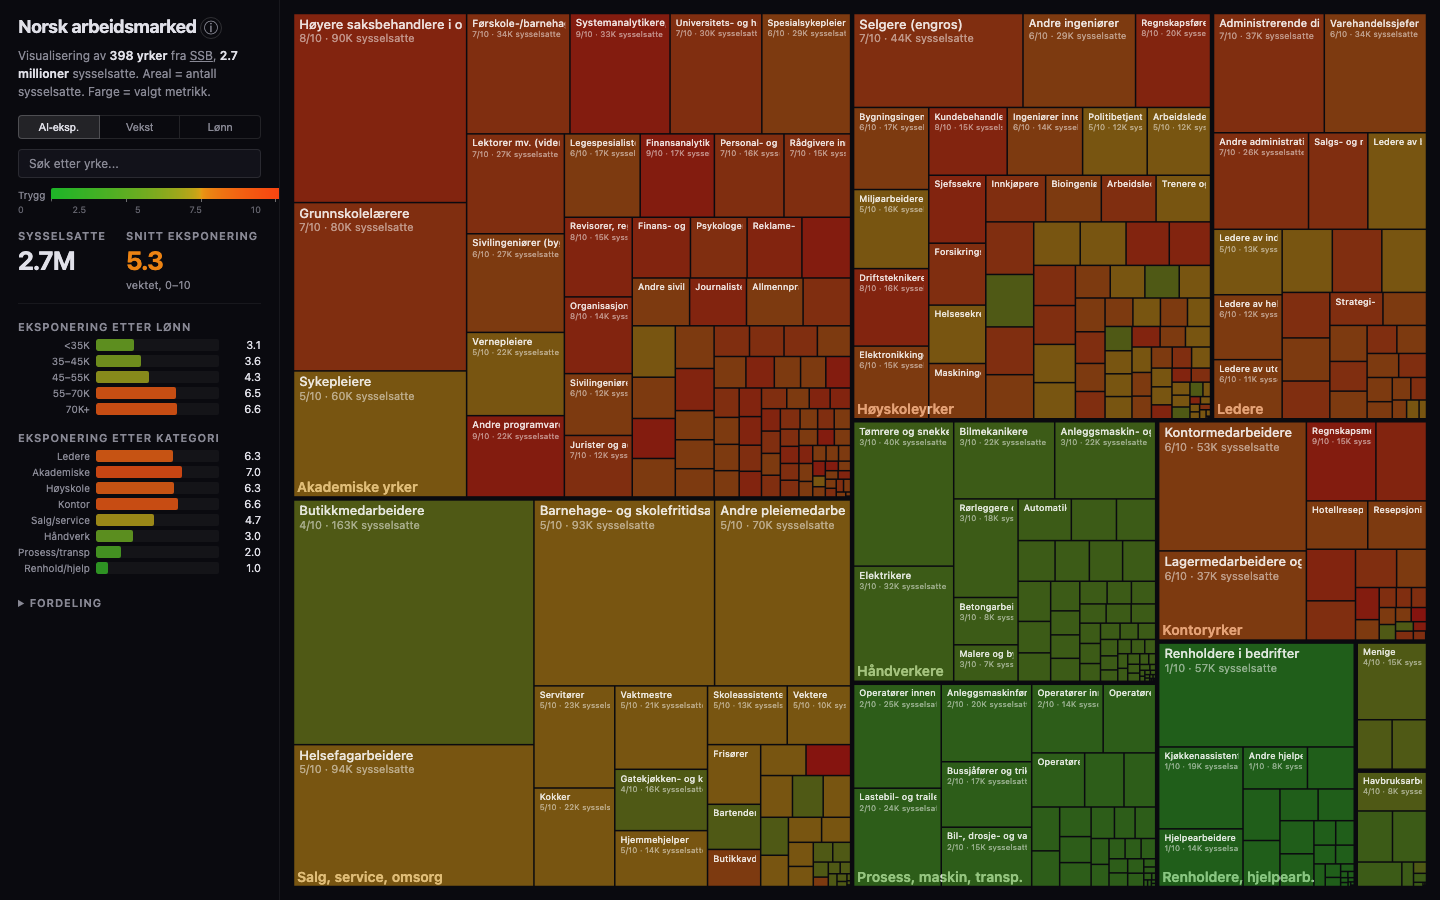
Norsk arbeidsmarked — Visualisering
Interactive treemap of 398 occupations across the Norwegian job market. Explore 2.7 million workers by salary, growth, and AI exposure based on SSB data.
Open Data · Interactive Charts · Norway & Sweden
A Data Journalism Collection
April 6, 2026 · Stardalen
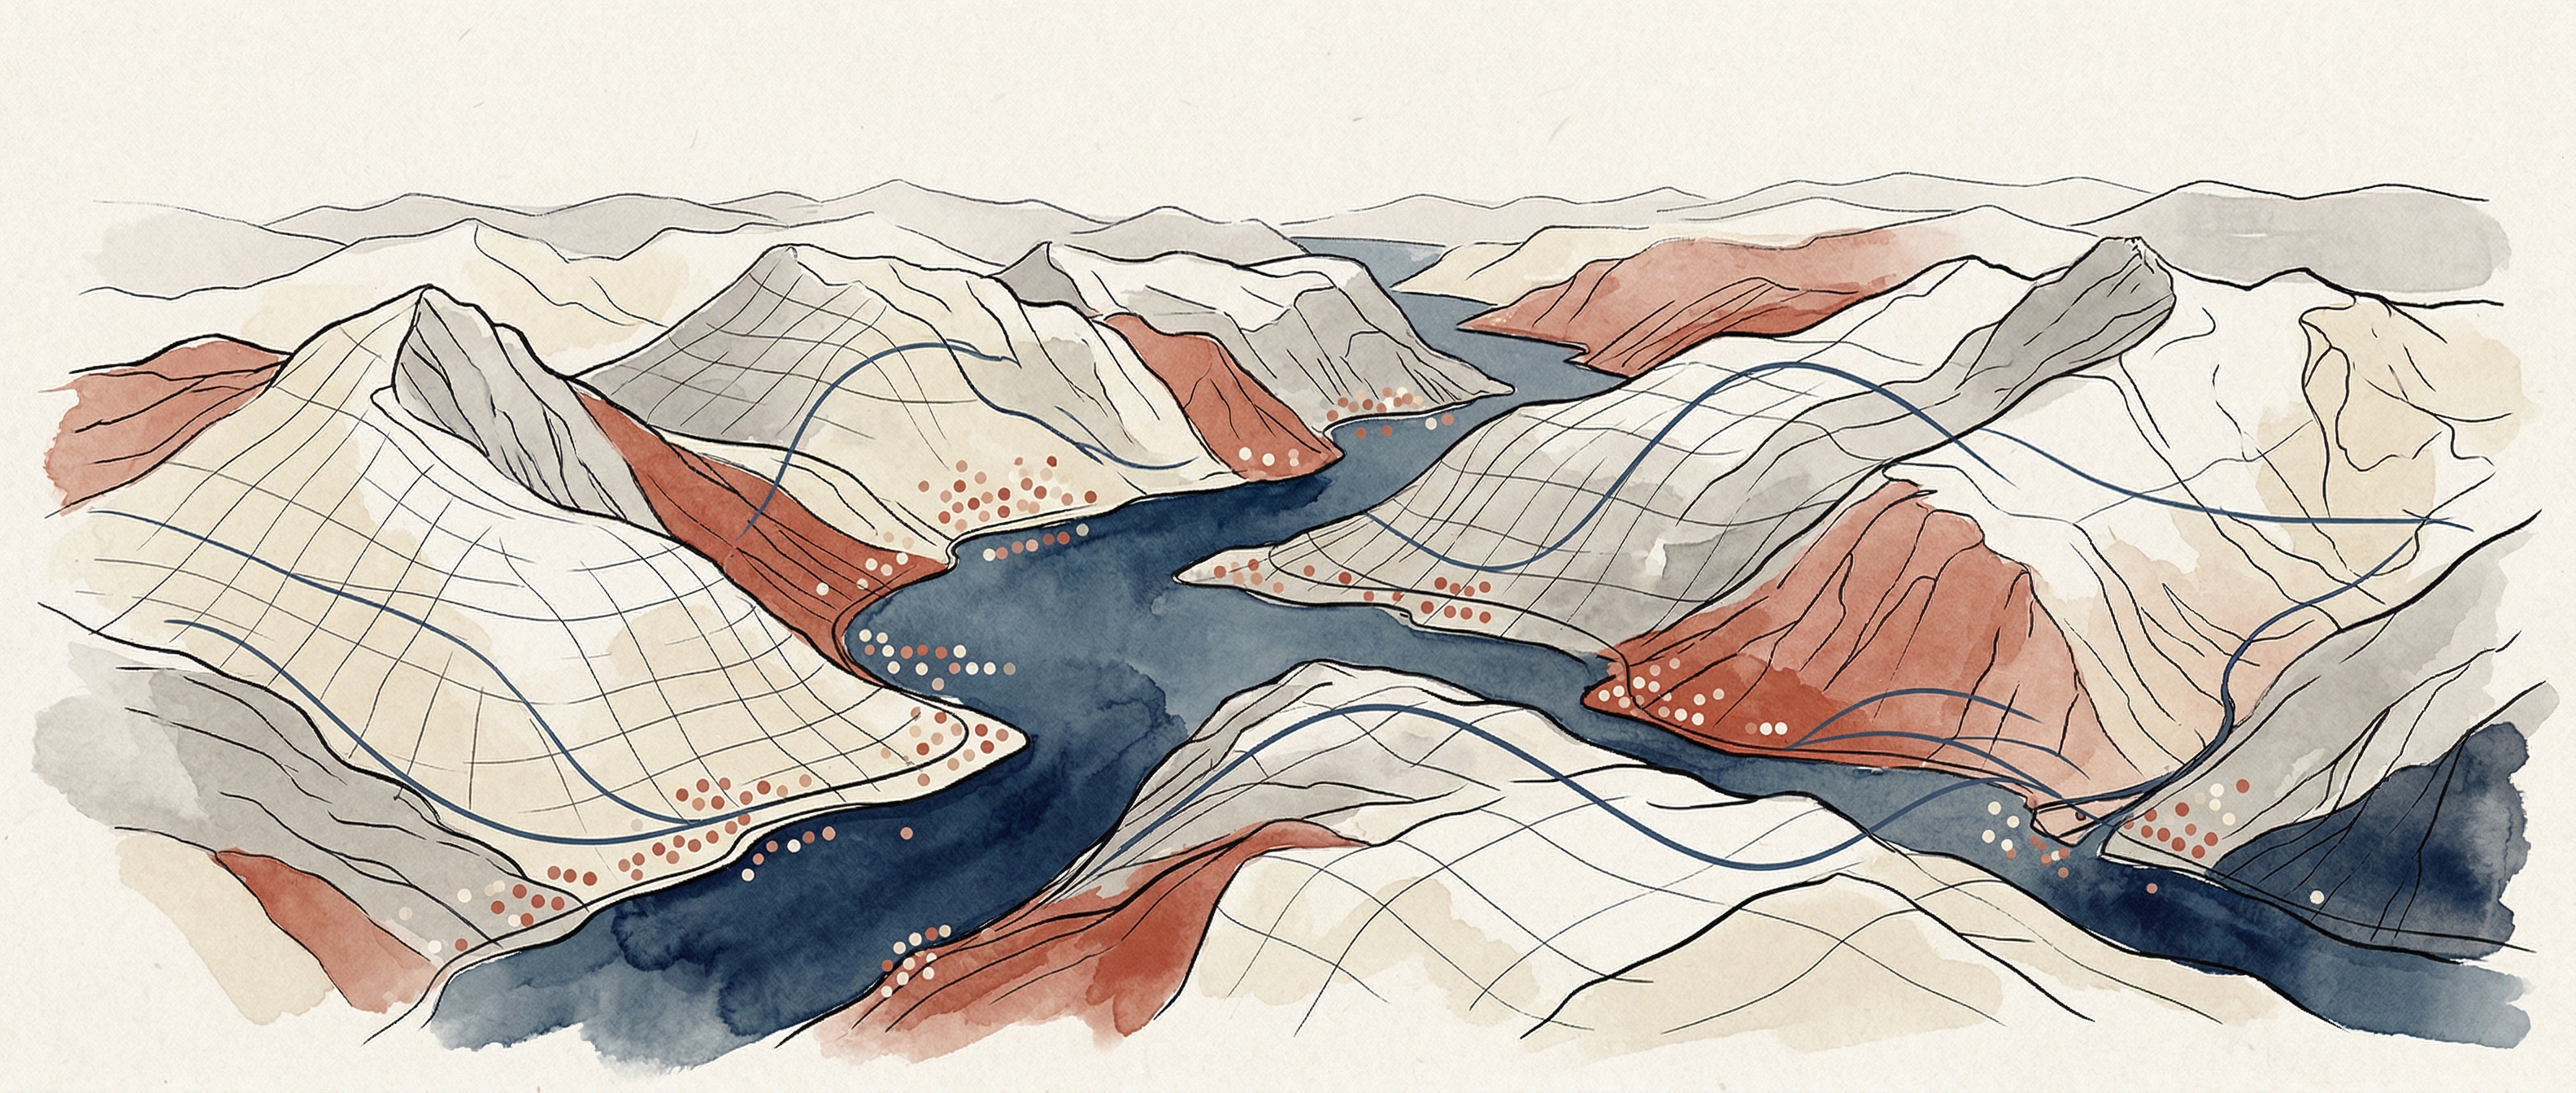
Illustration: fjords and data, an editorial rendering
A collection of interactive explorations into Norwegian public data — from AI’s impact on the labor market to digital sovereignty across Nordic municipalities.
How artificial intelligence is reshaping the Norwegian labor market — employment shifts, occupational risk, and the next generation of workers.
Interactive treemap of 398 occupations across the Norwegian job market. Explore 2.7 million workers by salary, growth, and AI exposure based on SSB data.
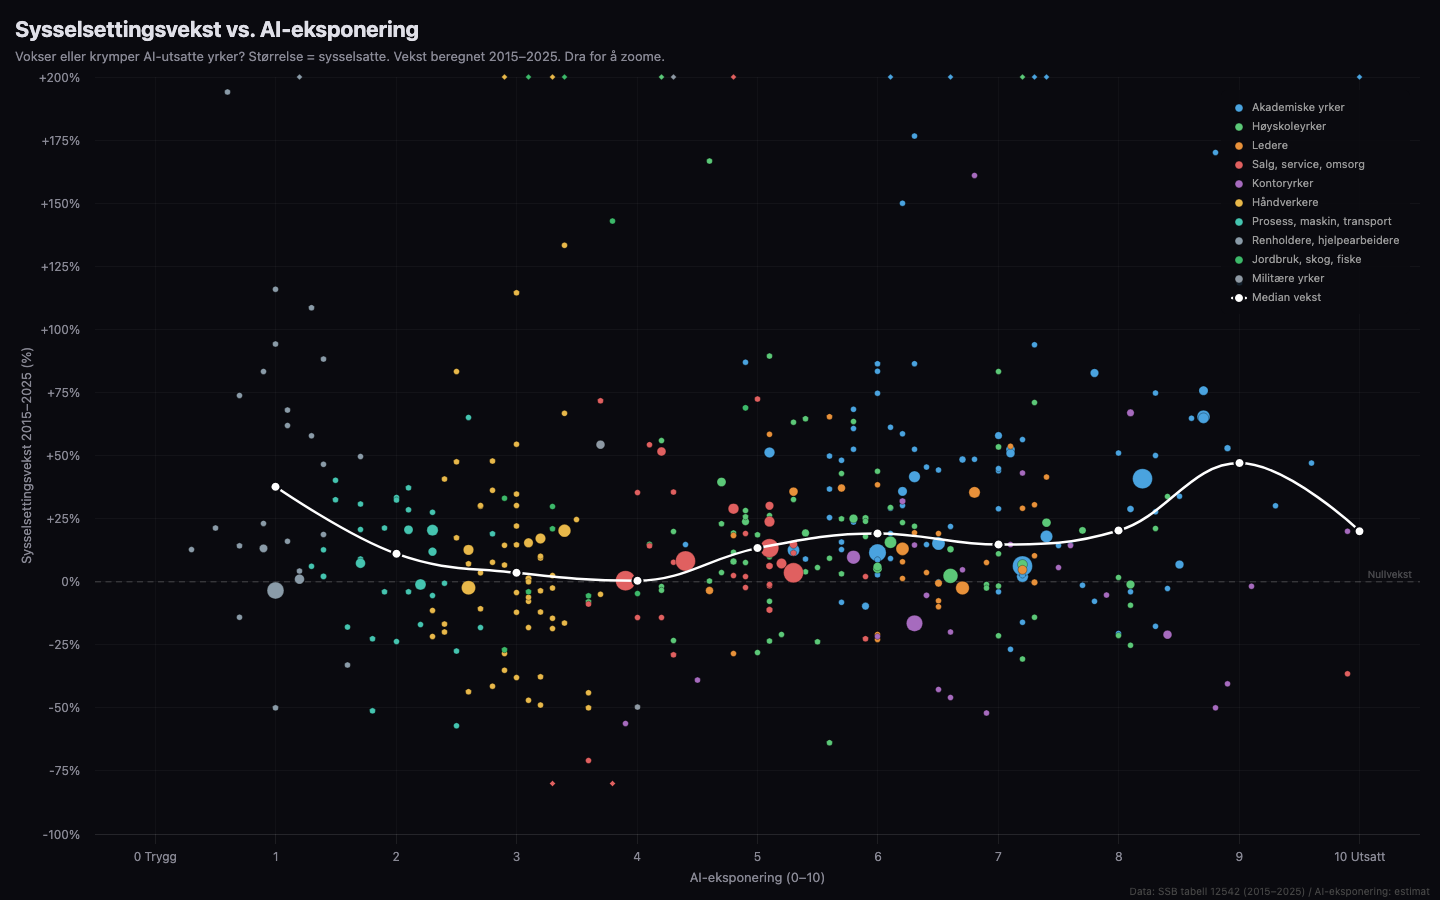
Scatter plot mapping employment growth (2015–2025) against AI exposure for Norwegian occupations. Bubble sizes reflect workforce numbers.
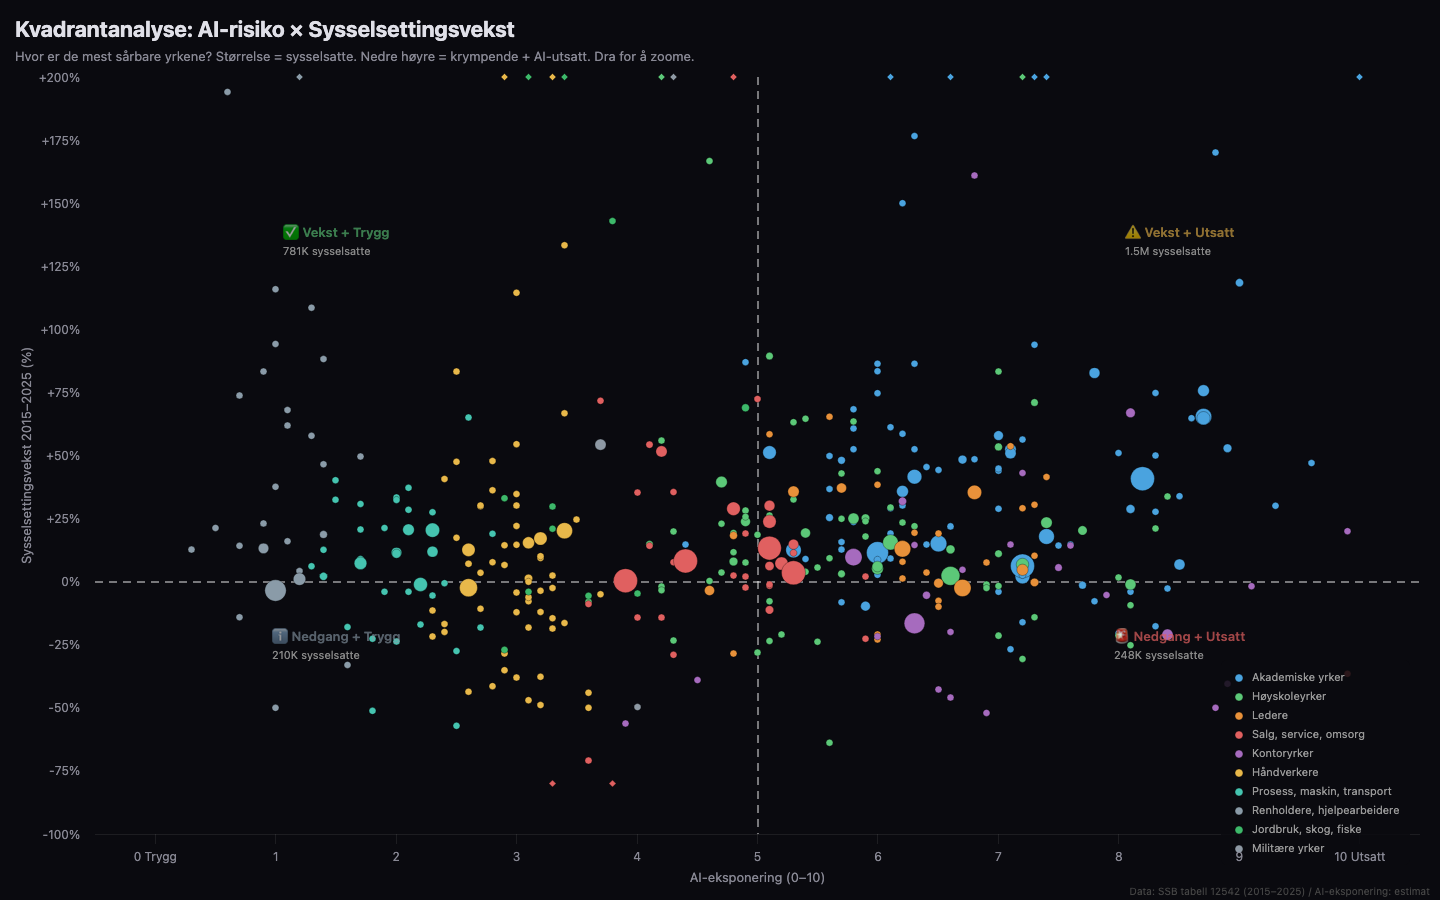
Quadrant analysis intersecting AI risk with employment growth. Identifies Norway's most vulnerable occupations — those shrinking and exposed to automation.
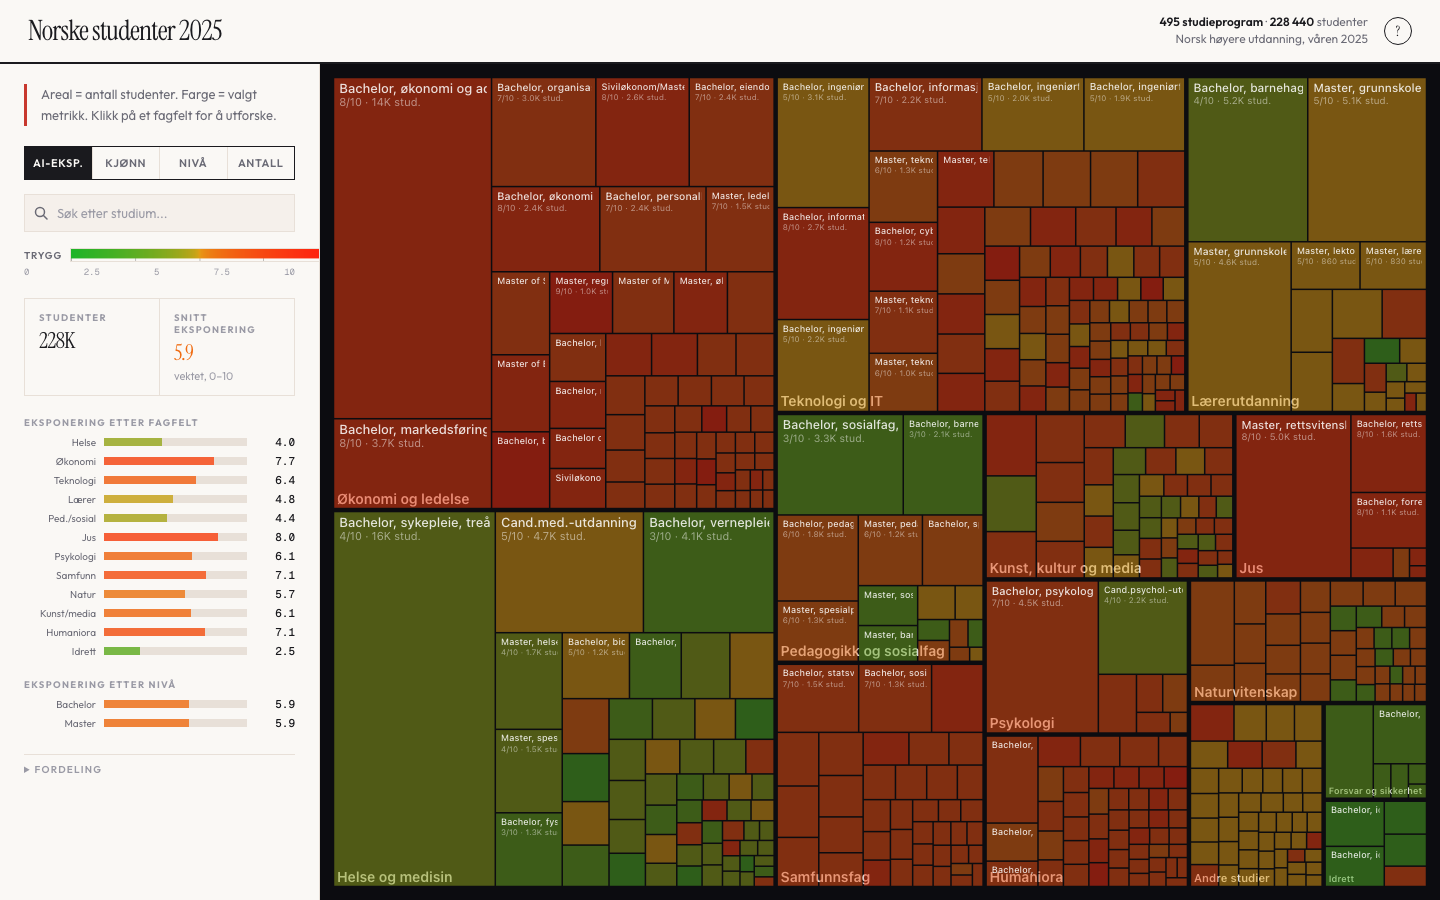
Treemap of 495 higher-education programs showing gender balance, degree level, and AI exposure. Area encodes student count for each program.
Nordic municipalities' dependency on American cloud infrastructure — mapping CLOUD Act exposure across Norway and Sweden.
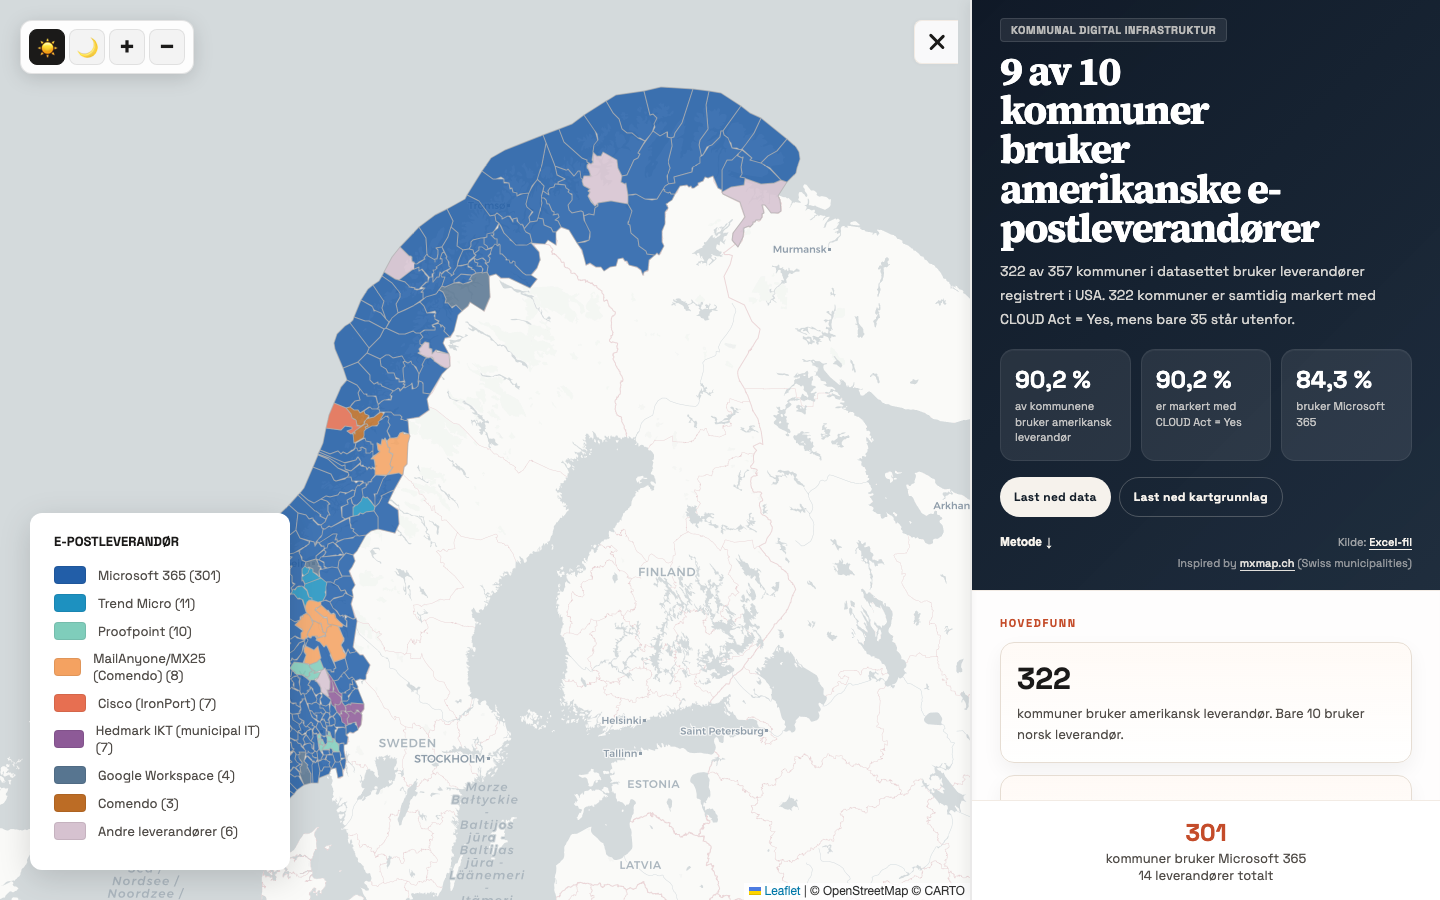
322 of 357 Norwegian municipalities depend on American email providers. Interactive map with CLOUD Act exposure analysis and country distribution.
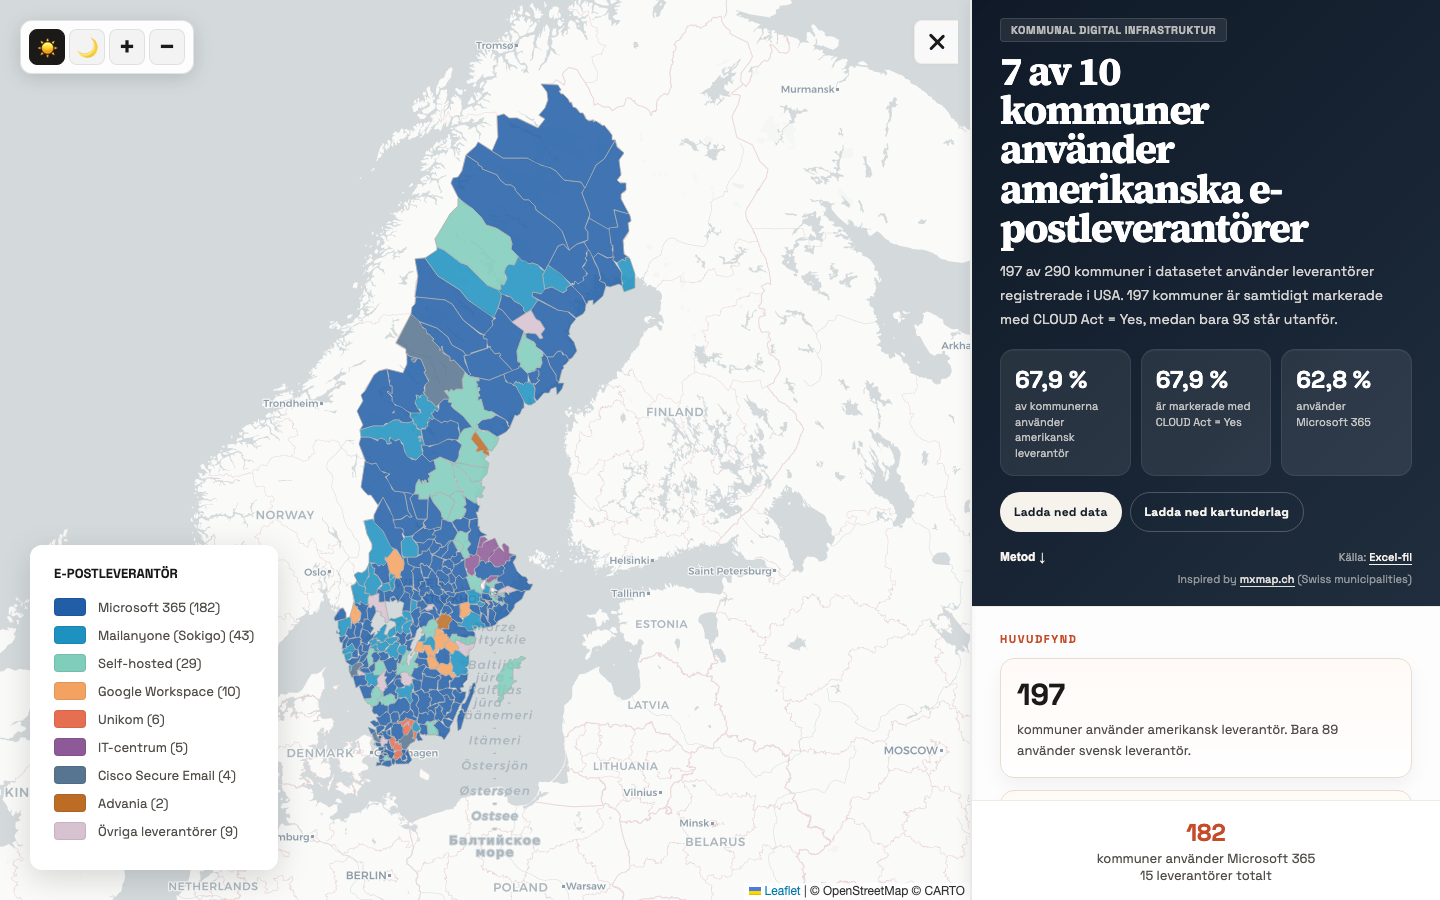
182 of 290 Swedish municipalities use American email providers. Map and analysis exploring CLOUD Act exposure across Sweden's municipal infrastructure.
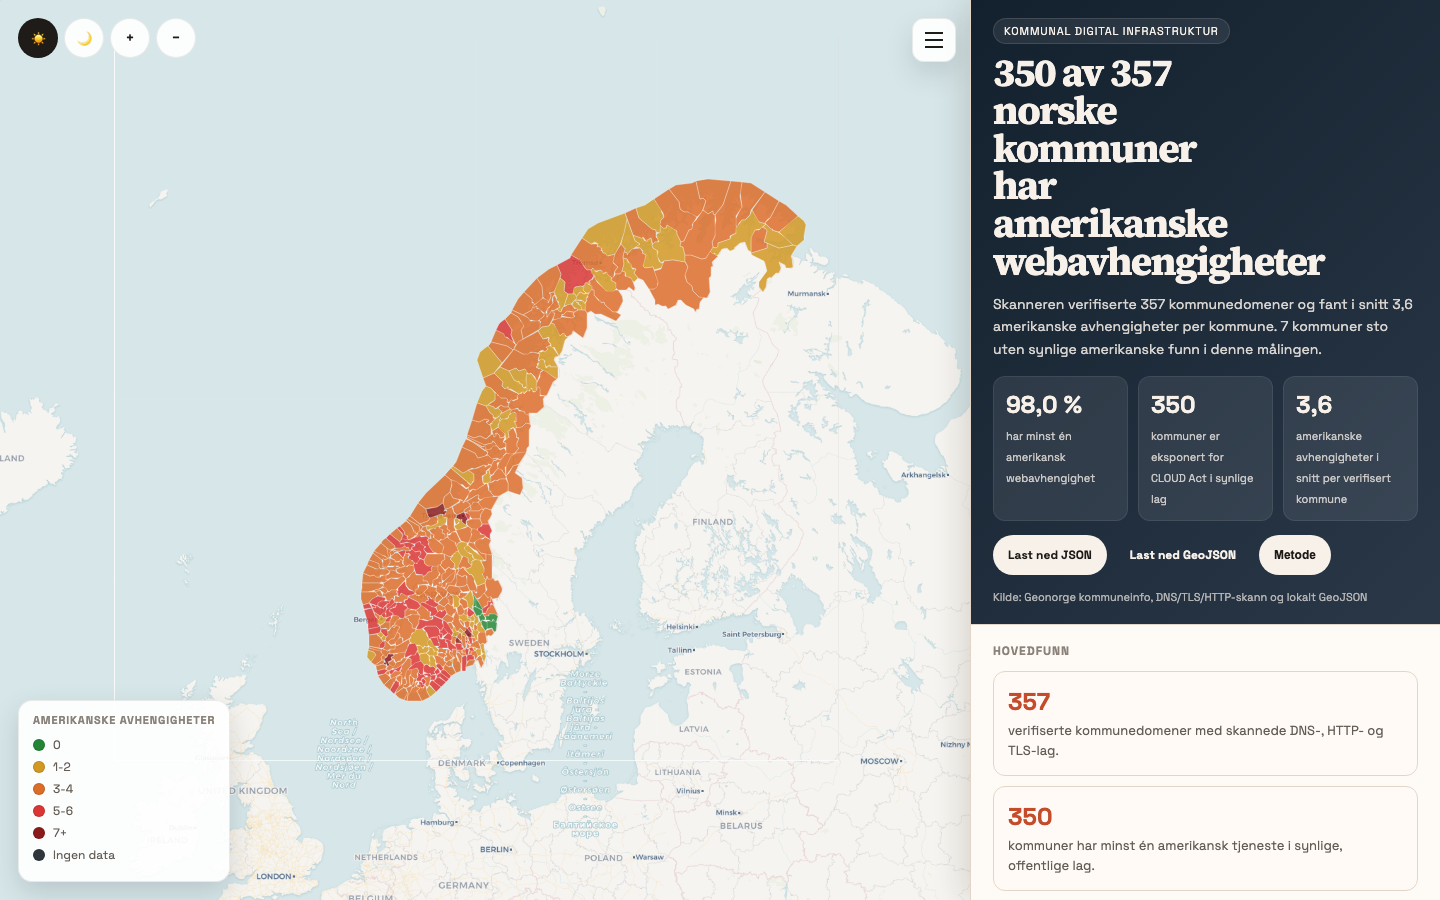
98% of Norwegian municipalities depend on American web infrastructure. Interactive map scanning DNS, hosting, TLS and analytics across all municipal websites.
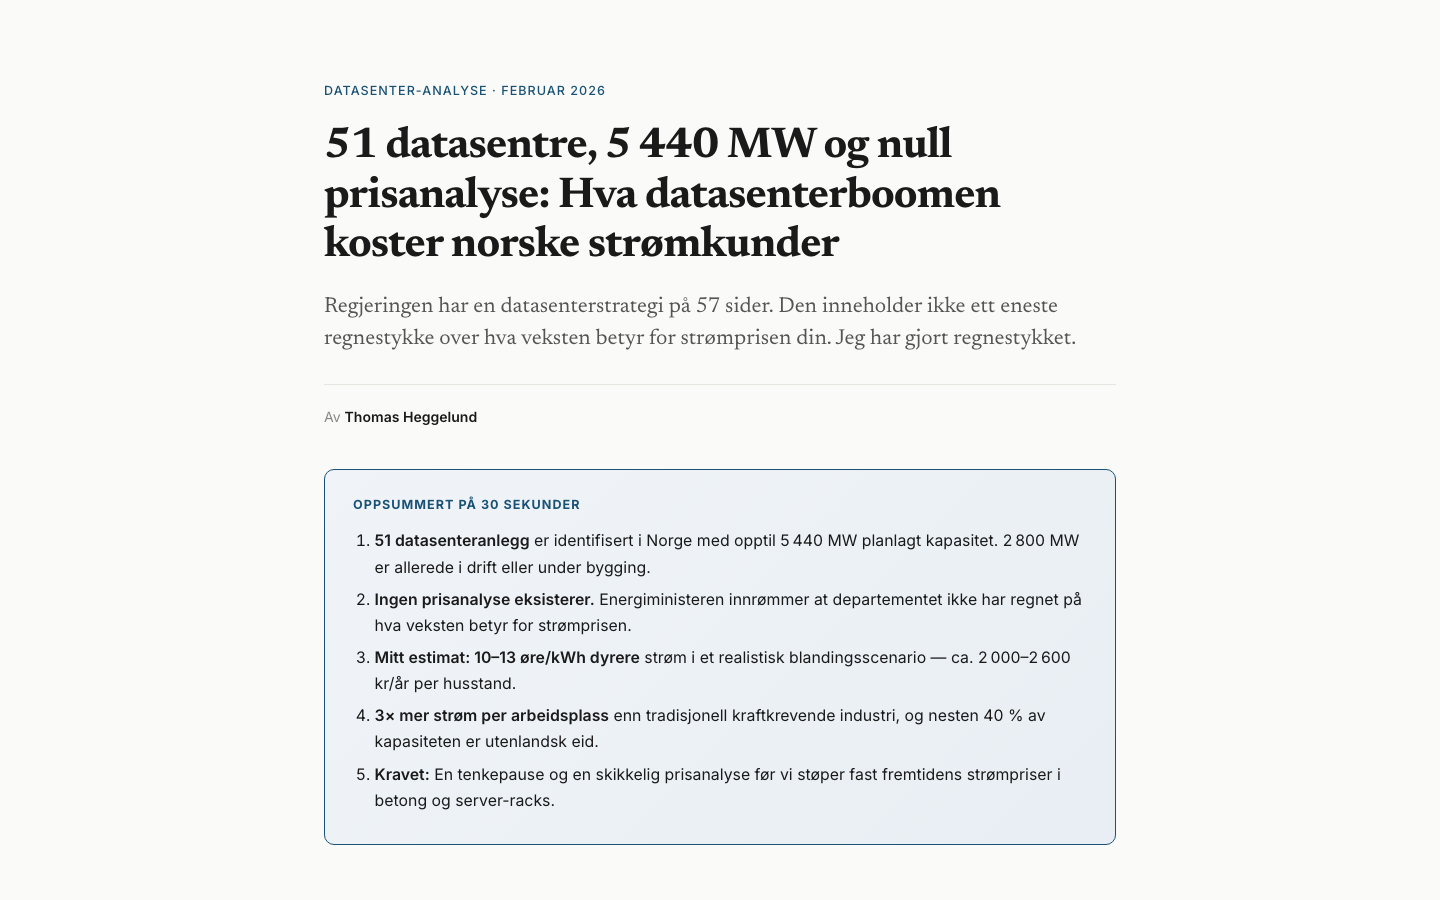
Interactive dashboard mapping power consumption and capacity across Norwegian data centers. Explore the infrastructure behind Norway's digital economy.
Kommune-level maps exploring demographics, economy, education, transport, and innovation funding across Norway's 357 municipalities.
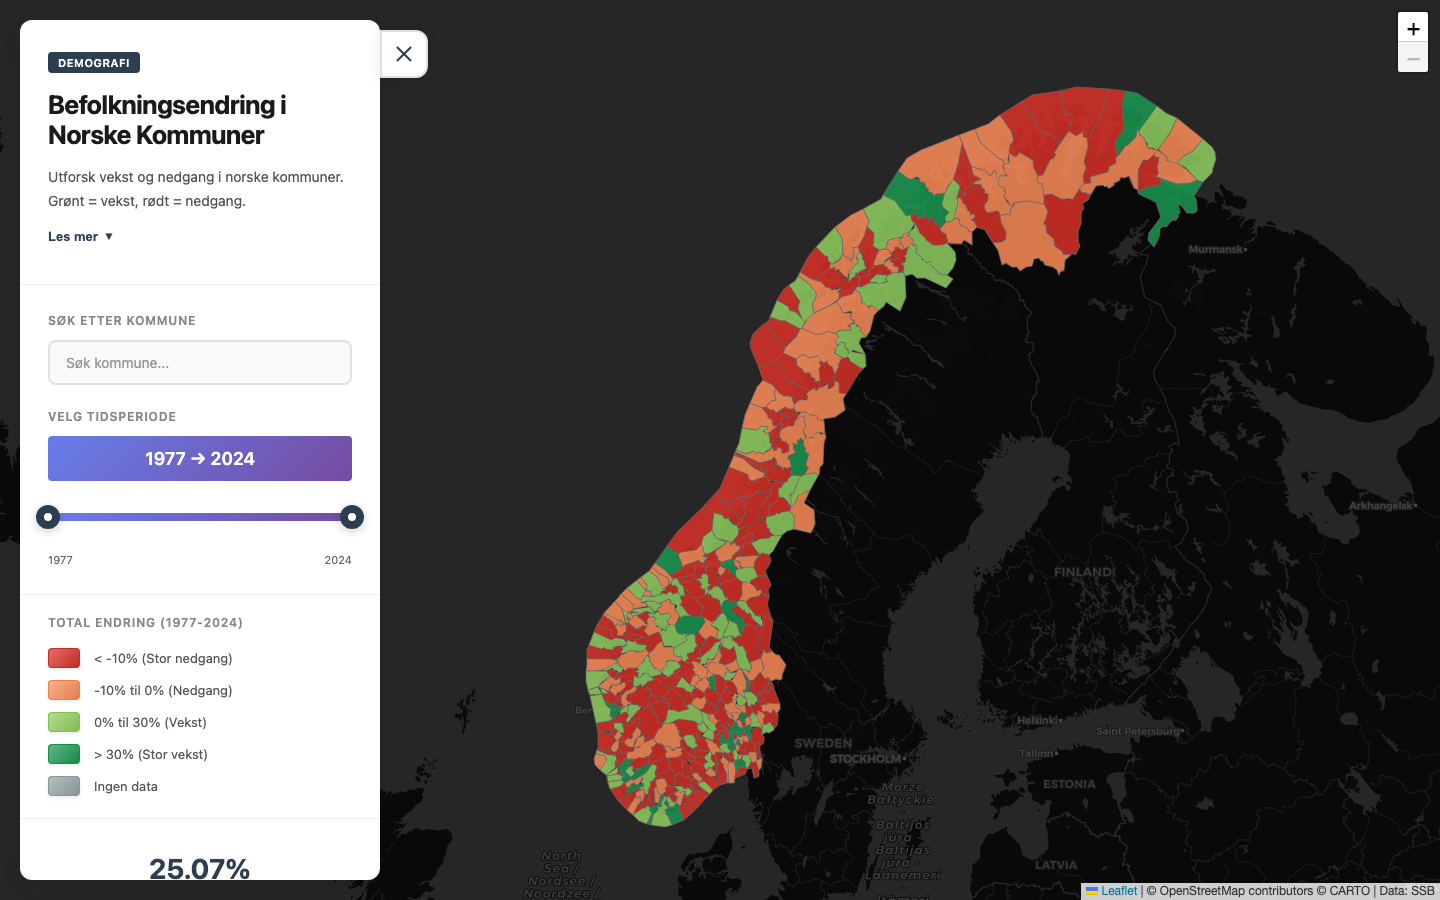
Population growth and decline across Norwegian municipalities from 1977 to 2024. Green marks growth, red marks shrinkage — explore the urbanization patterns reshaping Norway.
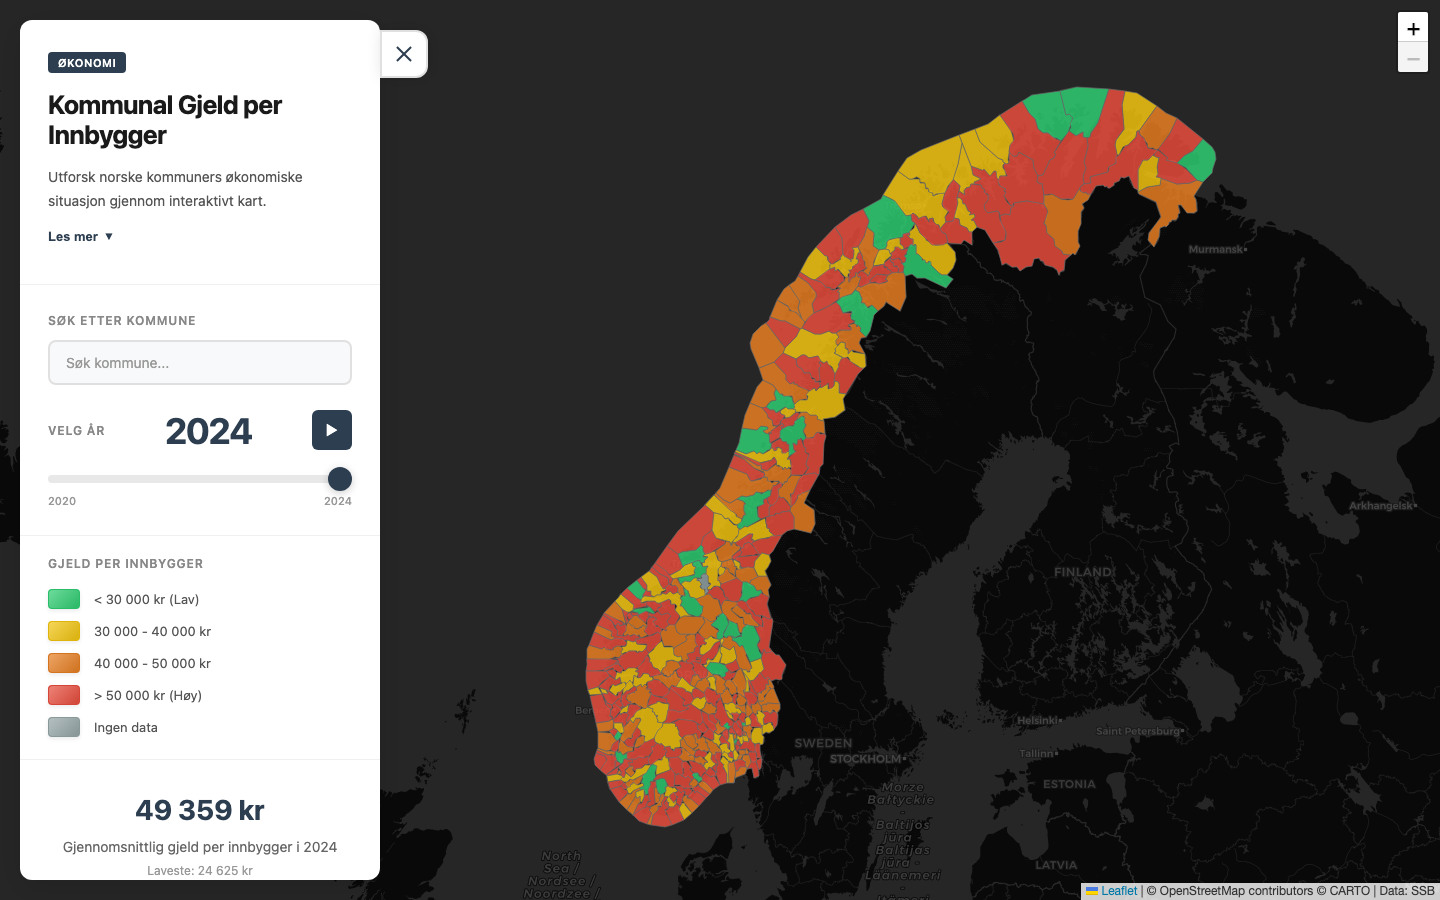
Explore the economic situation of Norwegian municipalities through an interactive debt map. Average debt per resident: 49,359 kr in 2024.
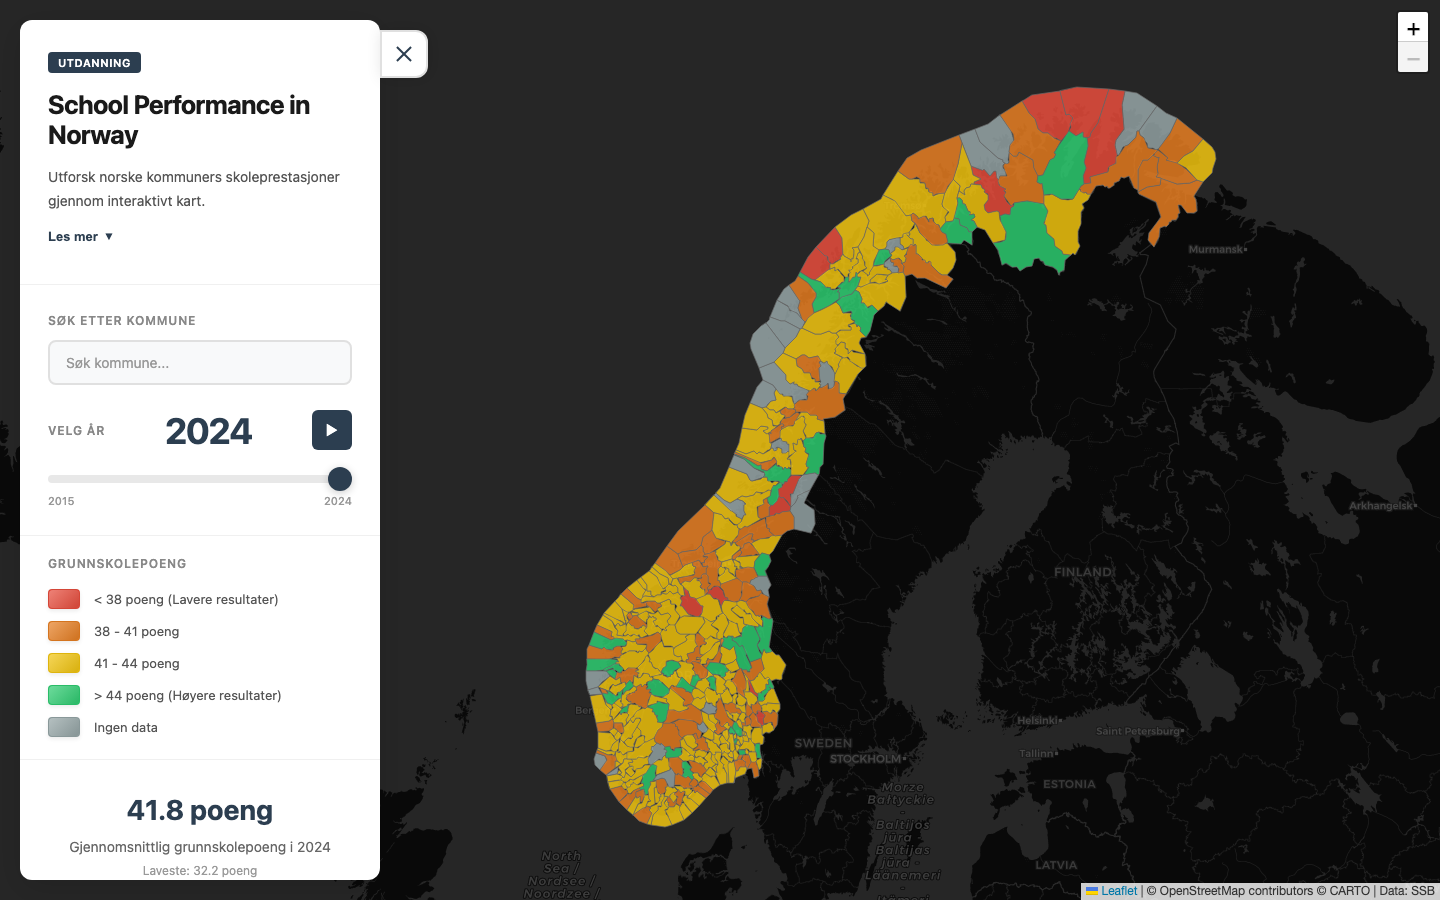
Grunnskolepoeng across Norwegian municipalities — mapping educational outcomes from 2016 to 2024. Average score: 41.8 points.
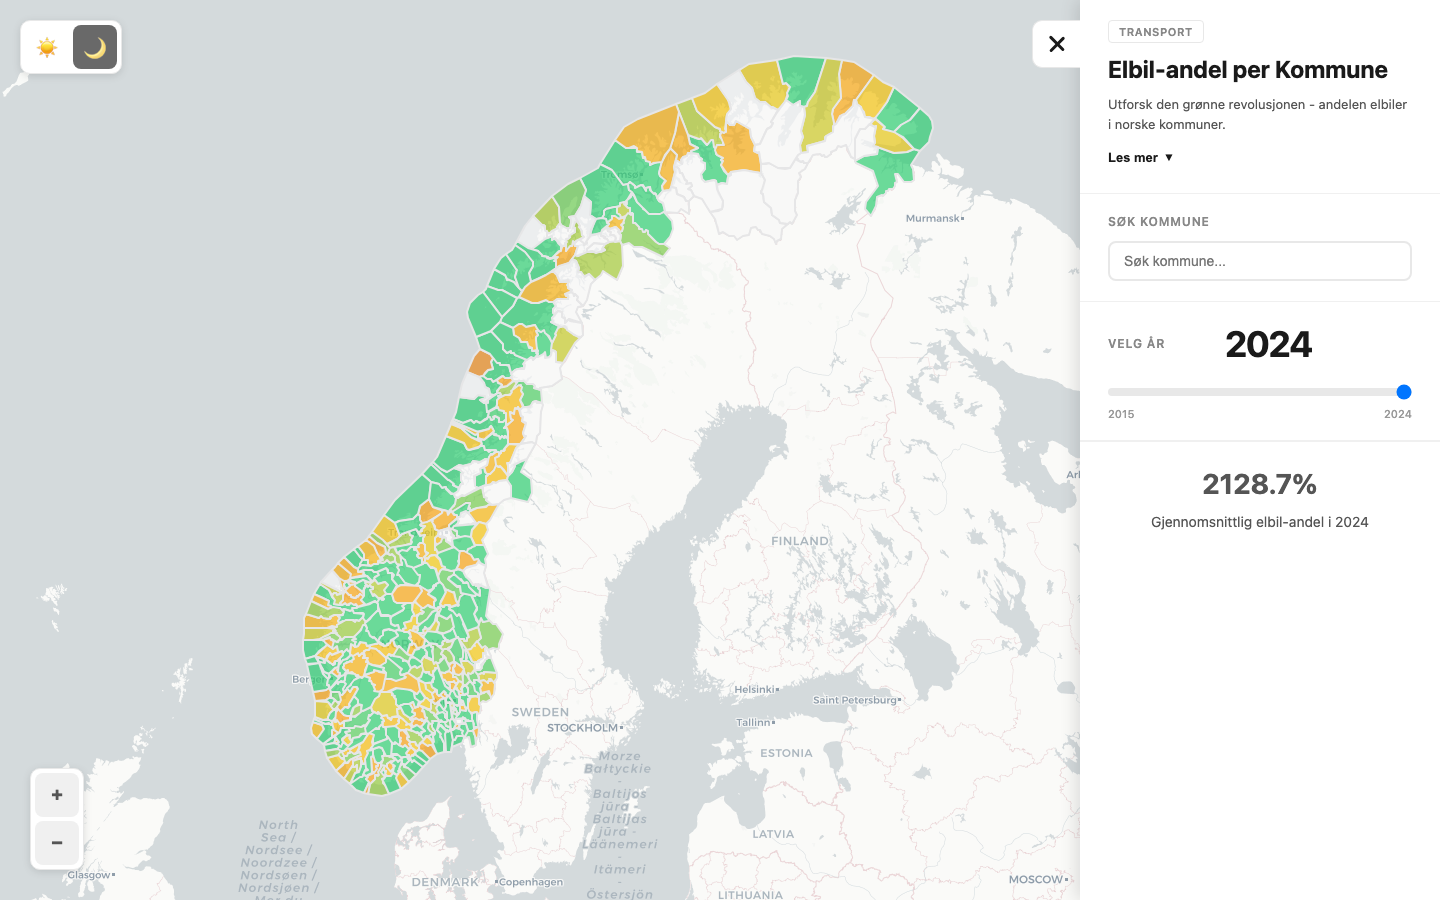
The green revolution municipality by municipality — from nearly 0% in 2010 to 17% average in 2024. Explore how EV adoption varies across Norway.
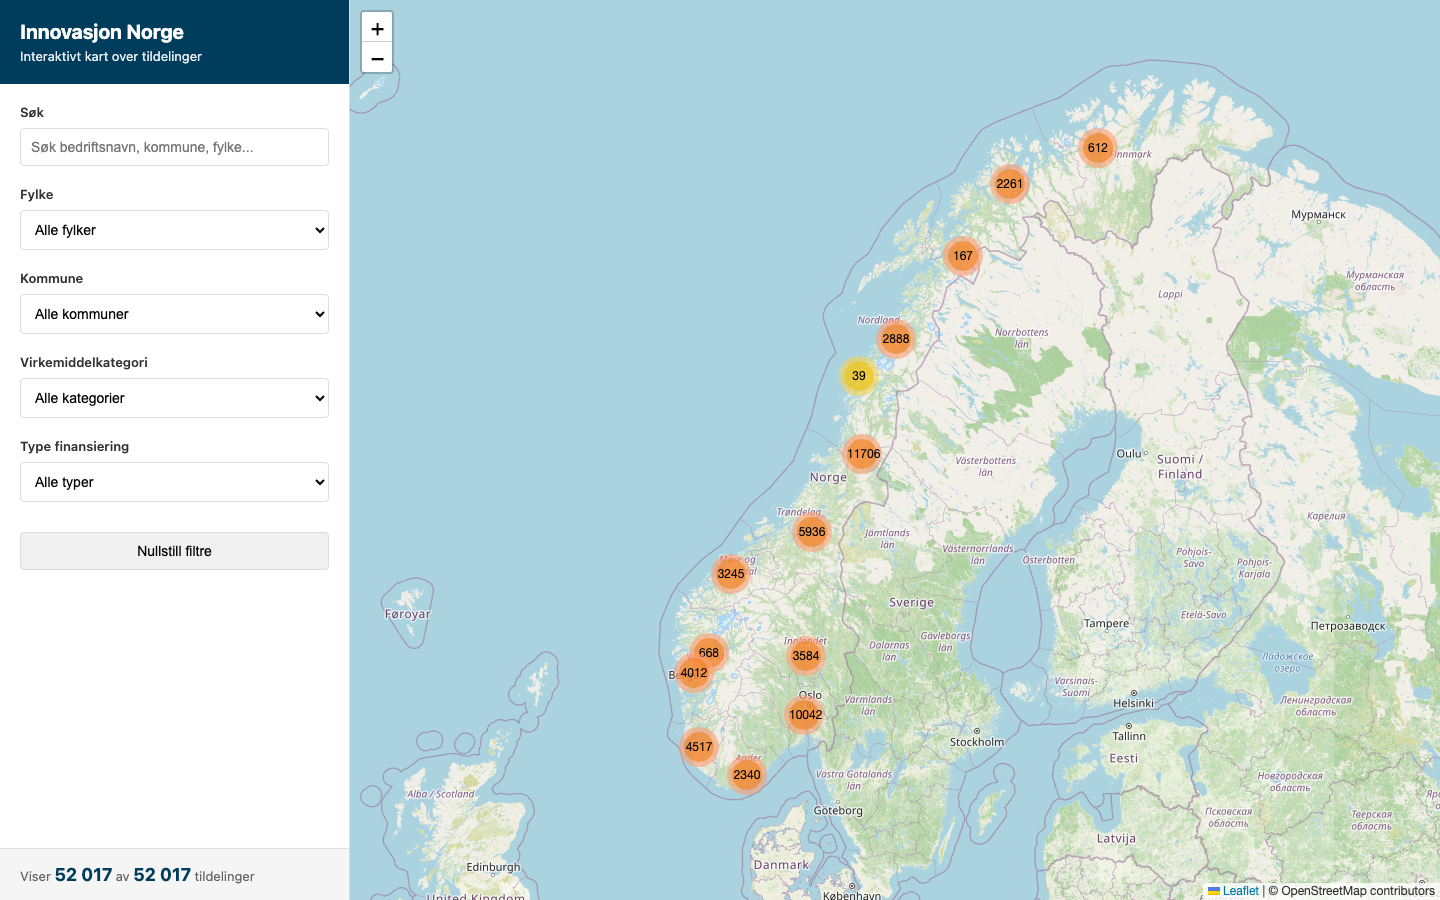
52,017 grants and funding allocations mapped across Norway. Filter by fylke, kommune, category, and financing type to explore where innovation money flows.
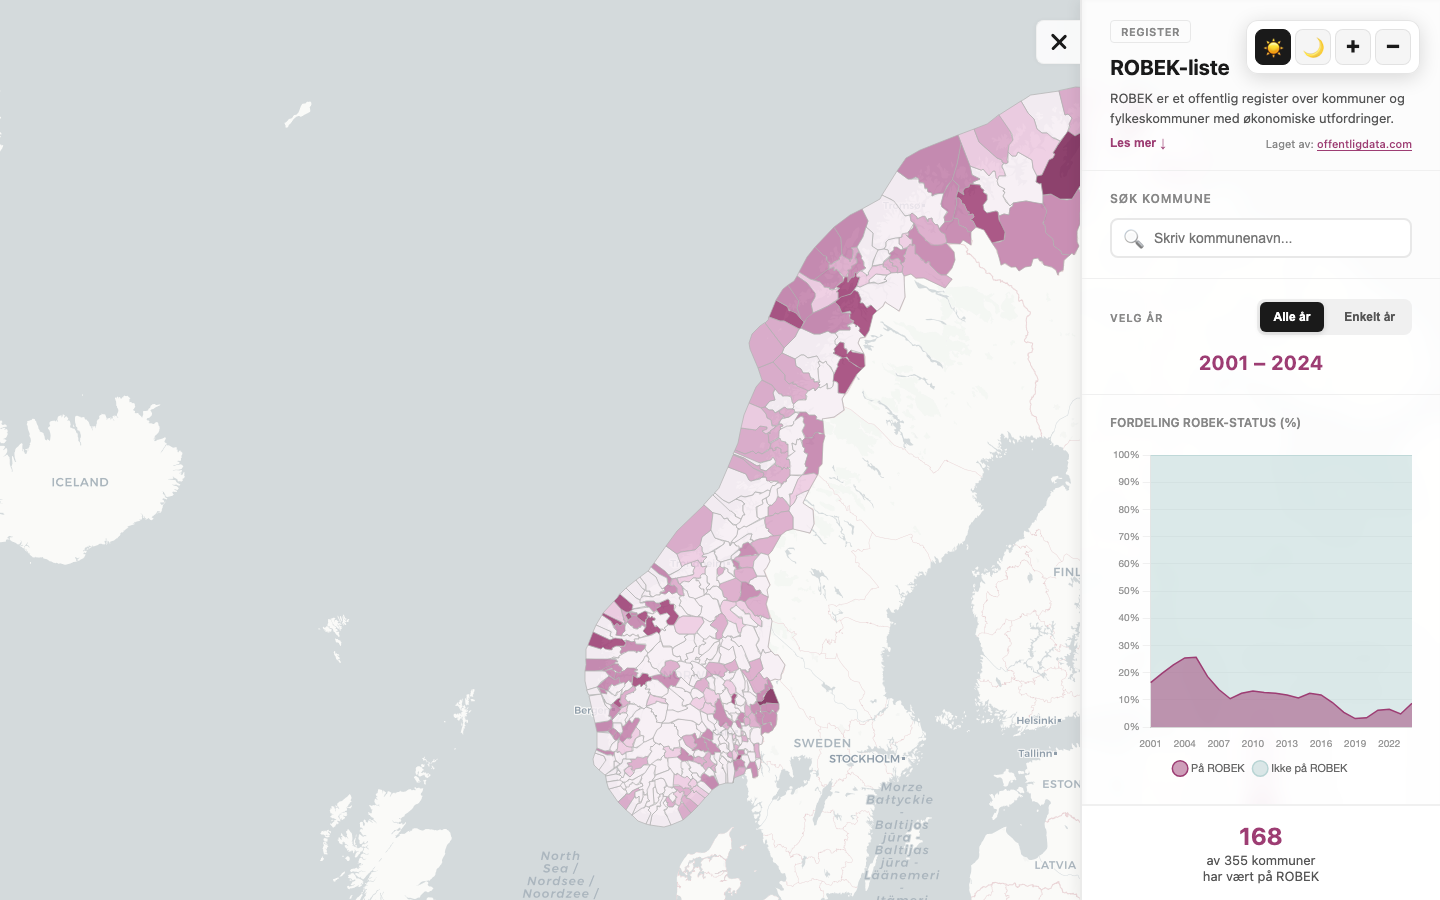
Which Norwegian municipalities have been under state economic control since 2001? Interactive map with historical data, timeline from 2001–2024, and 168 registered municipalities.
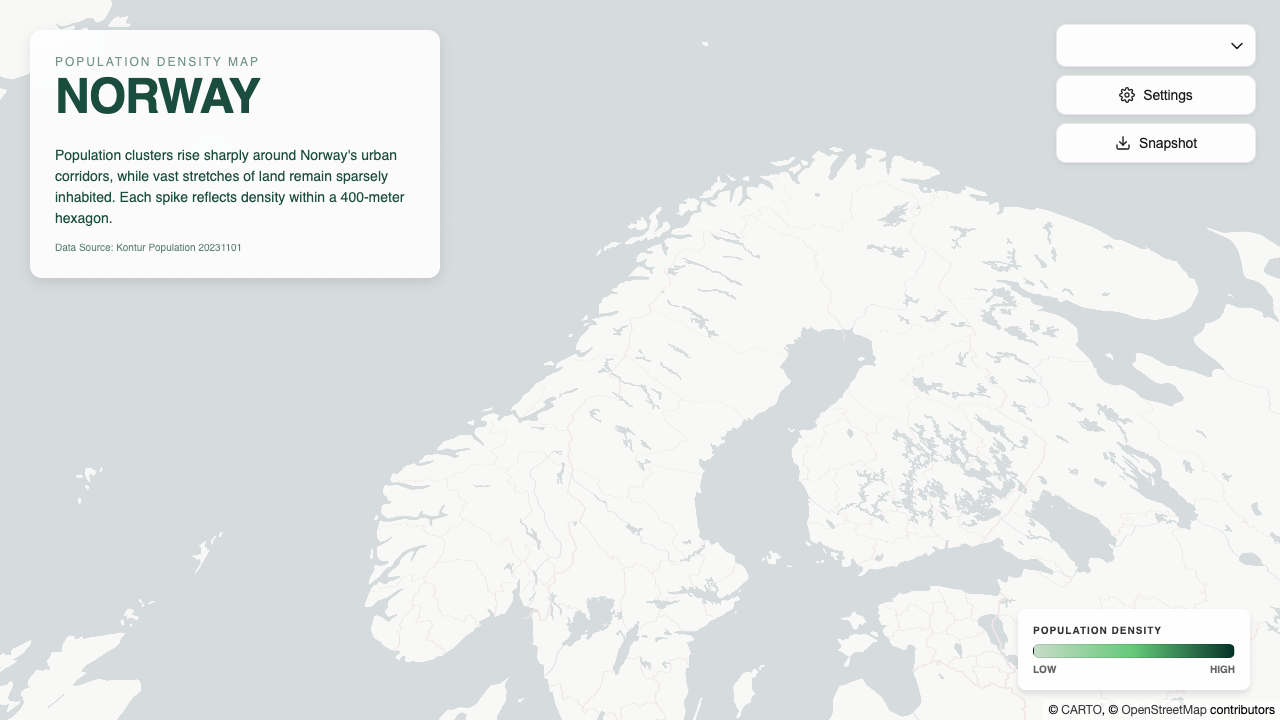
Global population density visualized as 3D hexagonal columns on an interactive map. Taller columns reveal denser areas — explore how the world's population concentrates across every country and continent.
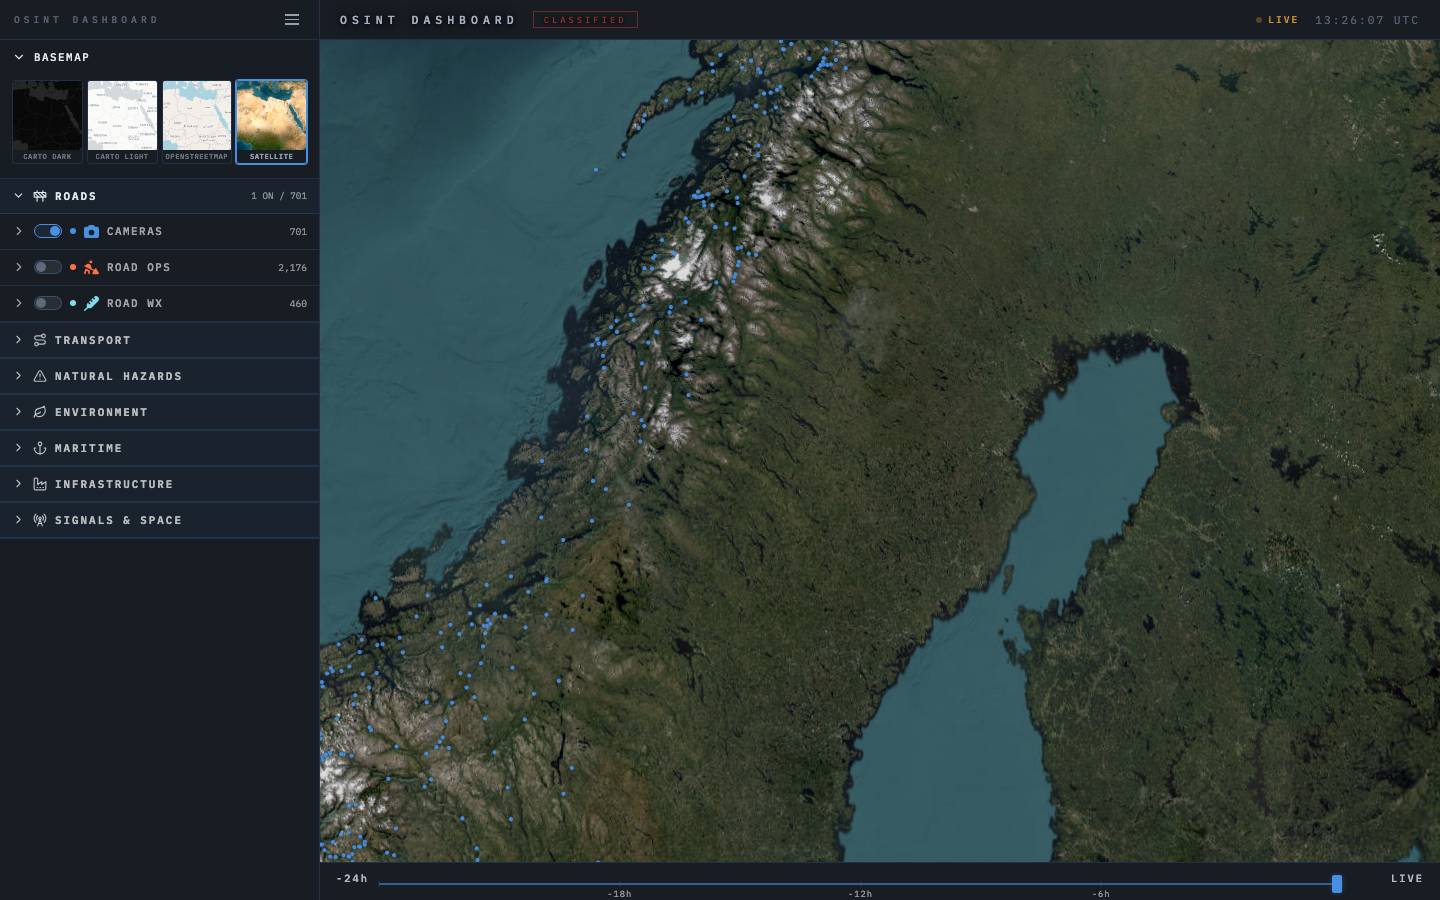
Real-time geospatial intelligence — roads, cameras, transport, natural hazards, maritime, environment, and infrastructure monitoring on a 3D globe.
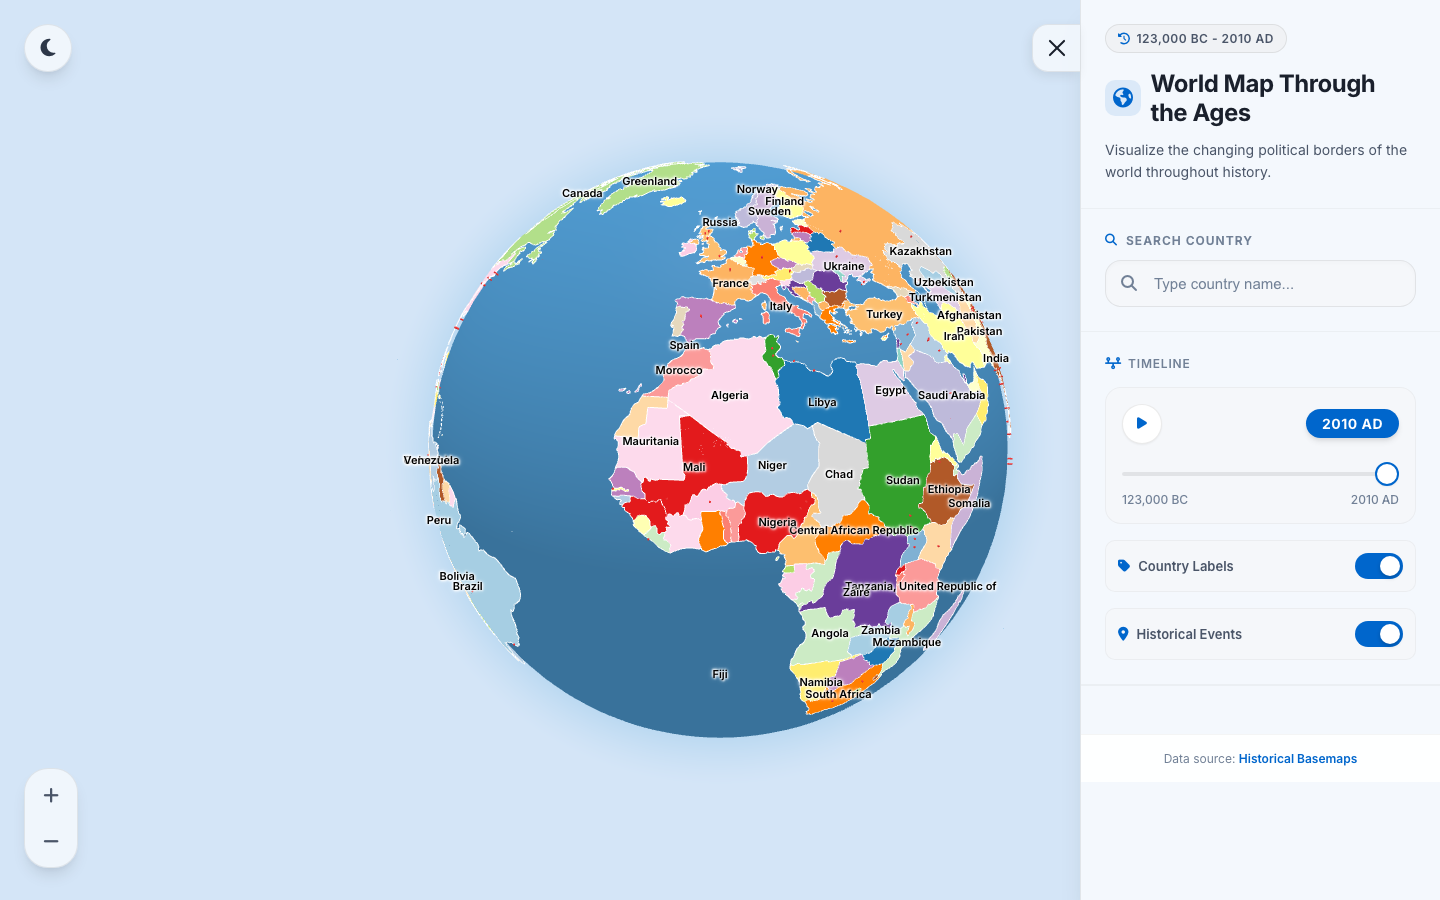
125,000 years of human civilization rendered on a 3D globe — political borders, migrations, and the rise and fall of empires.
Have a question, suggestion, or data request? We'd love to hear from you.